Theory
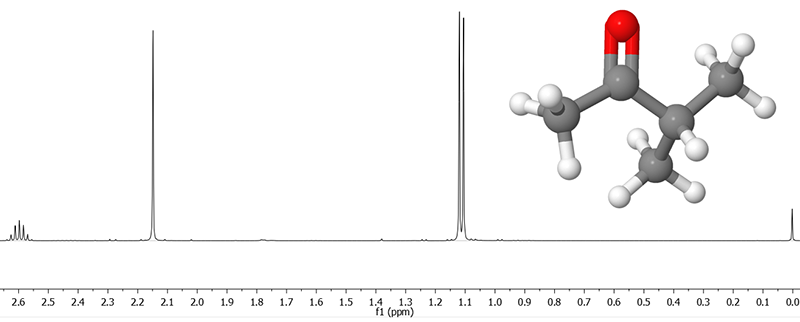
NMR spectra come in very many different types, depending on the nuclei involved and the type of experiment that is carried out, but this section is limited to the interpretation of NMR spectra resulting from single pulse 1H (i.e. proton) experiments of liquid samples (including dissolved substances). Already this arguably simplest type of experiment leads to very information-rich spectra that can help you deduce the structure of many organic molecules. An example of the NMR spectrum of methyl isopropyl ketone is shown below.

In a single pulse experiment, the sample is brought into the center of a very strong magnetic field and subsequently exposed to a strong burst (a ‘hard pulse’ in NMR terms) of radiofrequency radiation. The frequency of this radiation covers the range of frequencies with which the magnetic moments of the nuclei of interest (in this case: protons) in the sample precess around the very strong external magnetic field of the NMR magnet: the precessional motions of the magnetic moments of the nuclei are said to be resonant with the applied radiation.
The result of applying the hard pulse is that the individual magnetic moments tilt over an angle that is determined by the strength and duration of the pulse. In a single pulse experiment these two parameters are chosen such that the net magnetization (the vector sum of all the invidual magnetic moments) of the sample becomes tilted 90° with respect to the external magnetic field. The pulse is then referred to as a 90° pulse ('ninety degree pulse'). The figure below shows a common pictorial representation of a 90° pulse and the corresponding track that the tip of the net magnetization vector follows during the pulse.
After the 90° pulse has ended, the individual magnetic moments resume their precessional motion around the external magnetic field, but because of the 90° tilt caused by the pulse, now their net magnetization also precesses around the external magnetic field.
This rotating magnetic field induces an alternating current in a detection coil, which can be measured to give the NMR signal. This signal is called a free induction decay or FID. The ‘free induction’ in this term signifies the induced current, caused by the freely rotating net magnetization.
The ‘decay’ warrants some additional explanation: after the end of the pulse, the individual magnetic moments, whilst precessing around the external magnetic field:
- slowly (relatively speaking) tilt back towards their original orientations; this is called T1 relaxation.
- dephase: due to slight differences in their surroundings, the frequencies of the precessional motion of the individual magnetic moments differ, so they gradually 'fan out', and start to point in different directions; this is called T2 relaxation.
The effects this has on the net magnetization are depicted schematically below. The tilting back of the individual magnetic moments leads to the tilting back of the net magnetization (figure A). The dephasing of the individual magnetic moment leads to a reduction of the intensity of the net magnetization (figure B). Together this results in a spiralling motion such as in figure C. Finally, the net magnetization is oriented in the direction of the external magnetic field again.
Note that the frequency of the precession is depicted orders of magnitude too small. In truth, the magnetic moments and, hence, the net magnetization rotate hundreds of millions of times over the course of the free induction decay.
The figure below depicts the free induction decay that originates from the precessional motion of the magnetic moments of the protons in methyl isopropyl ketone molecules. Note, in particular, the periodicity of the signal on several 'zoom levels' and the decay of the signal over time.
The FID is the actual signal recorded by an NMR spectrometer, but it is not very intelligible for humans. Therefore, a mathematical technique called Fourier transformation (FT) is applied to it. The FT effectively transforms the complicated sum of oscillations in time to separate peaks in frequency. This is the NMR spectrum. The NMR spectrum of methyl isopropyl ketone shown at the start of this text is the result of Fourier transforming the FID shown here.


